The website works like an encyclopaedia arranged in ten topics. Under each topic you will find a range of areas that in words, pictures and figures explain trends in the given area and describe the political goals. ‘Natur og Miljø 2009’ is only available in Danish. However, for those who have a partial understanding of Danish, the instructions below on how to use the website may be useful:
Use the toolbar at the top to select a topic.
Select e.g. ‘Klima og energi’ (Climate and energy). This brings you to a new page. In the menu to the left you will find seven different sub-topics. In the middle column there is a short introductory text that summarizes the most important information with regard to climate and energy. In the column to the right you can open the climate and energy topic or one of the other ten topics as pdf documents.
To learn more about e.g. energy consumption, select ’Tema 5.1 Energiforbrug’ (Topic 5.1 Energy consumption). This brings you to another new page. The left-hand menu remains. In the centre column you will see text and a number of figures. At the top, the most important information for the sub-topic is provided. The text itself then comes in three parts:
In the right-hand column you can download a range of pdf documents, as well as a datasheet for the area selected. See below. In addition, suggestions are provided for places where you can read more about the subject.
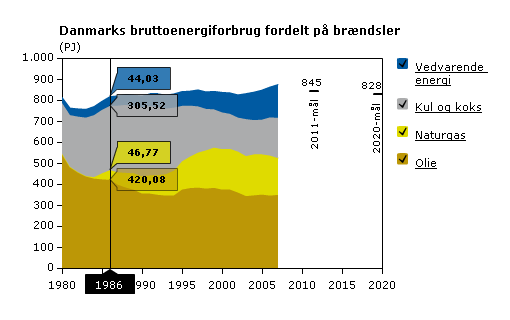
The figures are interactive and provide the user with some further options. By moving the mouse over the graphs you can see the precise values. You can also select or deselect graphs and data by clicking on the key to the right of the figure.

You also can change the x-axis by pointing to the axis with the mouse, holding the button down and marking the area you would like to zoom in on.
The underlying data and sources for the figures can be accessed by clicking on the link to the datasheet in the right-hand column. See below.
Data and sources, etc for all the figures can be accessed by clicking the datasheet link in the right-hand column. This opens a spreadsheet with underlying data for the figures, source references, the contact person responsible and the date of the latest update. The data can be used freely with appropriate reference to ‘Natur og Miljø 2009’ (see Hvem står bag) and the original source provided.
You can also use the search function in the upper right-hand corner to find information on a particular topic (only works in Danish). Many will have found themselves on the ‘Natur og Miljø’ website from using one of the internet’s search engines.